For decades, organizations have relied on the same data quality playbook. It ensures accuracy, verifies completeness, maintains consistency, validates formats, monitors timeliness, and eliminates duplicates. These disciplines emerged from enterprise data warehousing, where the stakes were ensuring correct financial reports and reliable business intelligence dashboards.
Today, that playbook is dangerously incomplete.
The explosive growth of AI has fundamentally changed what "data quality" means. A machine learning model can score 95% accuracy on traditional data quality metrics while denying loans to creditworthy applicants of certain races. Training data can pass every completeness, validity, and uniqueness check while underrepresenting minority populations. Production systems can drift into algorithmic bias without triggering a single data quality alert.
This recognition that as data moves from powering reports to powering decisions about people, measurement standards must evolve. This is driving a fundamental shift in how organizations approach data governance. The question for data leaders is not whether to adopt fairness-aware data quality metrics, but how to do so pragmatically.
The Legacy Approach: Built for a Different Problem
Traditional data quality frameworks emerged during the 1980s and 1990s when organizations saw the shift into centralized warehouses. It ensured that summary reports reflected operational reality. These frameworks codified best practices around six core dimensions:
| Dimension | Definition | Legacy Focus |
|---|---|---|
| Accuracy | Data correctly represents real-world entities | Financial reporting precision |
| Completeness | All required records and fields are populated | Prevent null value errors |
| Consistency | Uniform data formats across systems | Master data alignment |
| Validity | Data conforms to defined formats and rules | Schema enforcement |
| Timeliness | Data is current for its intended use | Report freshness |
| Uniqueness | Entities appear only once without duplication | Prevent double-counting |
These metrics worked remarkably well. The assumption here is that data quality problems manifest as technical defects. When data obeys to its schema and maintains referential integrity, legacy thinking assumes it's "clean."
Why Legacy Metrics Fall Short for AI
AI systems disproves this assumption in three critical ways.
First, algorithmic bias remains invisible. A hiring model trained on historical employment data might pass all traditional quality checks while maintaining gender discrimination encoded in historical hiring patterns. Your data quality scorecard shows green lights while the model misjudged qualified applicants.
Second, the distribution shift goes undetected. A fraud detection model trained in 2023 may perform well on its original distribution while silently degrading as attack patterns evolve. Legacy quality checks won't catch this because the data conforms to its schema. It's just different data than what the model was trained on.
Third, fairness trade-offs remain implicit. Organizations deploying AI systems often optimize accuracy without acknowledging that fairness and accuracy frequently conflict. This leaves fairness decisions to chance rather than intentional design.
Novel Metrics for Modern ML
Organizations are adopting three new categories of data quality metrics designed specifically for AI systems.
Representation Metrics: Is Your Data Representative?
For the data representation, calculate Distributional distance which compares training data distributions to production traffic patterns. The Population Stability Index (PSI) measures how much feature distributions have shifted:
| Distribution Shift | PSI Range | Interpretation |
|---|---|---|
| Stable | < 0.10 | No action needed |
| Moderate shift | 0.10 - 0.20 | Monitor closely |
| Significant shift | > 0.20 | Retrain model |
Intersectional coverage assesses representation across demographic subgroups simultaneously. Real-world bias often emerges at intersections that aggregate metrics and miss entirely.
Example: Medical imaging models trained on datasets where minority groups comprised 20% of samples showed overall accuracy of 87-88%, but accuracy for Black and Asian patients dropped to 84.5% compared to 93.5% for White patients. The representation gap remained invisible until researchers examined subgroup performance explicitly.
Bias Indicators: Are Your Predictions Fair?
For Bias indicators, demographic parity measures whether the model makes positive decisions at similar rates across demographic groups:
| Group | Approval Rate | Disparate Impact Ratio |
|---|---|---|
| Privileged | 70% | 1.00 (baseline) |
| Protected | 50% | 0.71 ⚠ |
A ratio below 0.80 violates the EEOC 80% rule, signaling potential discrimination.
In this case, equalized odds ensures both the true positive rate (catching actual cases) and false positive rate (false alarms) are equal across groups. Example, in criminal justice, a recidivism model might achieve 80% true positive rates for two groups while producing false positives for 15% of innocent Group A members but 30% of innocent Group B members—a profound fairness failure.
Another way is to employ feature importance disparities and identify models that rely on different features for different demographic groups. Using SHAP values, if a model weighs credit score heavily for one group but ages heavily for another, it suggests potential proxy discrimination.
Fairness Trade-off Metrics: What Are You Actually Choosing?
Cost of fairness analysis measures precisely how much accuracy must be sacrificed:
| Target Fairness Level | Model Accuracy | Accuracy Loss | Cost-Benefit |
|---|---|---|---|
| Baseline (unfair) | 92.0% | — | — |
| 0.75 DPR | 90.3% | 1.7% | 15.9 pts/unit |
| 0.80 DPR | 89.2% | 2.8% | 18.9 pts/unit |
| 0.90 DPR | 85.7% | 6.4% | 24.7 pts/unit |
| 0.95 DPR | 84.0% | 8.0% | 26.7 pts/unit |
Organizations often discover that achieving demographic parity requires 2-3 percentage points of accuracy loss. Achieving near-perfect parity requires 8% points—a material sacrifice requiring intentional decision-making.
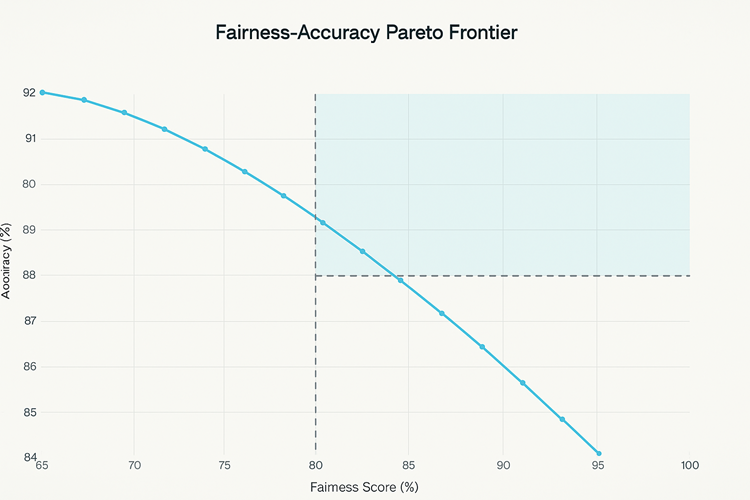
Pareto frontier analysis visualizes the full landscape of fairness-accuracy combinations. Organizations define "acceptable regions" that specify minimum accuracy and fairness thresholds, then monitor whether production models remain in bounds.

Figure 1: This visualization shows 15 optimal model configurations. Only 2 satisfy constraints of 88%+ accuracy AND 0.80+ fairness. This demonstrates how few configurations meet stringent requirements.
Making It Real: Implementation Strategies
A simple way to address this is to start with representation metrics. Unlike bias indicators that require model explanations or fairness metrics requiring ground truth, representation metrics use data you already have. Calculate PSI on key features using existing logging infrastructure. Pilot on 2-3 high-risk models first: those making consequential decisions or involving protected populations.
Next, establish measurement baselines early. During model development, perform retrospective analysis on what PSI values corresponded to acceptable performance? What representation ratios correlated with equitable subgroup accuracy? Document these baselines with supporting evidence rather than arbitrary cutoffs.
Connect monitoring to upstream processes. When bias indicators trigger, feed findings back to feature engineering and training data curation. If intersectional coverage metrics reveal underrepresented subgroups then initiate targeted data collection.
Organizations should also formalize governance. Document metric definitions, threshold rationales, and escalation procedures. Establish who owns each metric, what triggers require action, and what timeframes apply. Create public dashboards showing fairness metrics alongside accuracy metrics.
The Path Forward
Data quality has always been foundational to trustworthy analytics. What's changed is the definition of "quality." As AI systems increasingly mediate consequential decisions affecting human lives, data quality measurement must expand from detecting technical defects to quantifying representation, bias, and fairness trade-offs.
Organizations that adopt fairness metrics today position themselves as responsible AI leaders by building institutional capability while ahead of regulatory requirements. Those that delay face escalating risks discriminatory incidents generating lawsuits and reputational damage, regulatory fines under emerging AI legislation, and loss of talent to organizations demonstrating genuine commitment to ethical AI.
When the tools exist and the frameworks are established, then the remaining question is organizational will. Whether data and AI leaders will commit to expanding quality measurement from accuracy and completeness to encompass the fairness that AI's societal role demands.


