


It is just the 18th letter of the modern English Alphabet for some. To others, it’s the calculation of an attic’s insulation, an angry expression in comic books or ratings on movies. It is also fast becoming the programming language of choice for data scientists across the globe.
The statistical programming language ‘R’, the hugely popular successor to ‘S’, is now the lingua franca of the modern data geek- simply because data mining has now set foot in its golden age. Enterprises as diverse as Merck, Google, Shell, Bank of America, Pfizer and InterContinental Hotels use it. Be it finding new drugs, fine-tuning operational systems or setting ad prices, R is getting an endless stream of patronization from data science maestros and developers.
Although no different than the other programming languages like Java, C and Perl, part of the reason why it has become so useful and quickly accepted is that scientists, statisticians and engineers can write a different version for specific tasks and improve the code. Not to mention the unfair advantage in time and resource efficiency using preset code packages that is a massive draw among its user community.
The packages written for R add textures and colored graphs, mining techniques and advanced algorithms to delve a little deeper into all databases. Around 1500 packages reside on one of the several websites dedicated to R. Current number of downloadable packages from the official CRAN project site has grown to more than 13,000 and around 60,000+ people work with these packages regularly!
Visualizing to Actualizing- R Packages for Data Visualization
However, some tasks remain common to all users, irrespective of the primary area- including data visualization, data import, and data wrangling. Although this list can vary from person to person, DASCA has put together a list of R packages used widely for data visualization – the reason – data visualization has become so critical to every enterprise today or almost every part of getting tasks done as a data analyst, or data scientists.
Furthermore, DASCA believes that at initial phases of the data science career journey, data visualization (when works in tandem with data manipulation, of course) is considered sufficient for a good kick start in the career. If you’re at a junior or beginner’s level, then your primary responsibilities will revolve around data visualization. Since it’s mandatory for your productivity, it has become a skill that you need to master early.
-
1) ggplot2
While R’s conventional graphics provide an efficient set of plots, many of them demand a lot of hard work. At the same time, viewing identical plots in data for different groups becomes difficult. A plotting system for R, ggplot2 is based on the concept of grammar of graphics(gg) (independent specification of building blocks in a plot and later combining them to generate any graphical display). ggplot2 allows one to generate graphs that represent multivariate and univariate categorical and numerical data in a simple manner. It also offers robust models that help in producing complicated multi-layered graphics easily.
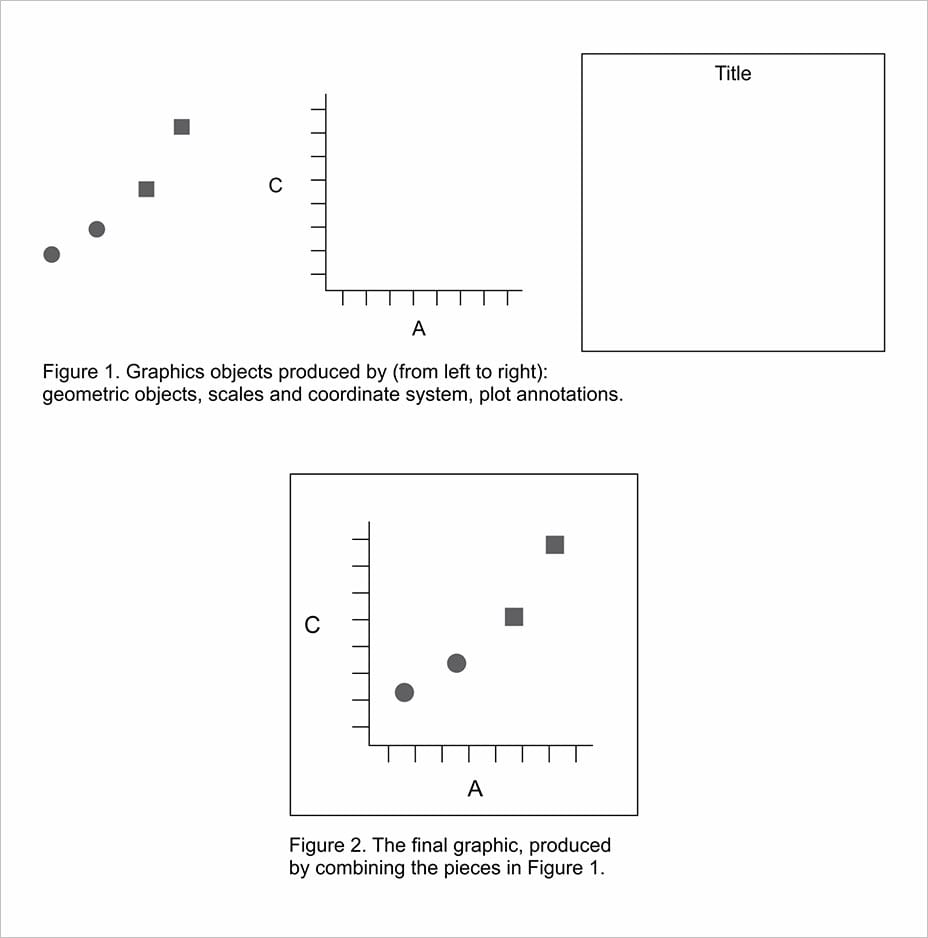
* Function of ‘Grammar of Graphics’
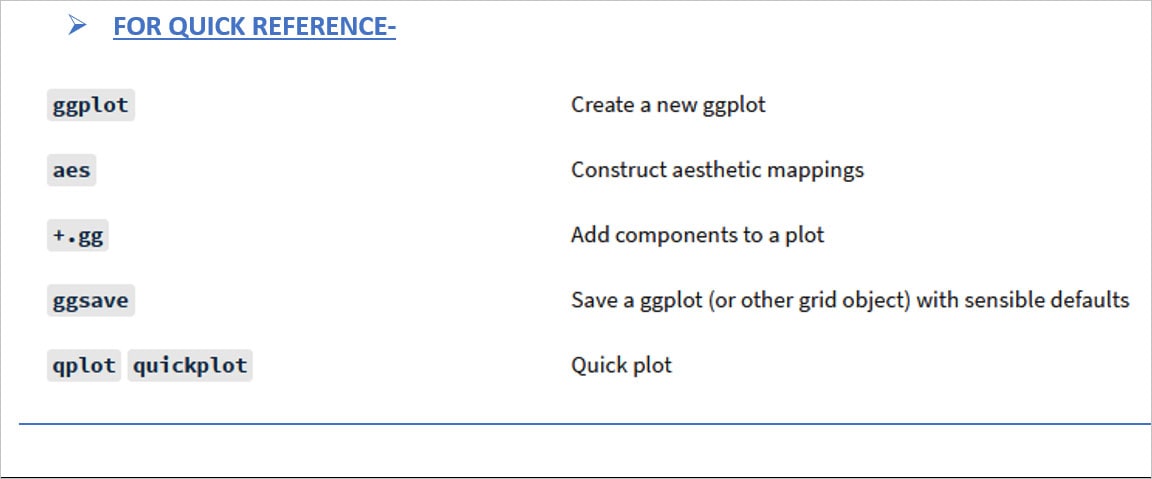
To make it simple for beginners to get started, ggplot2 offers two primary functions- ggplot () and quickplot () (or qplot).
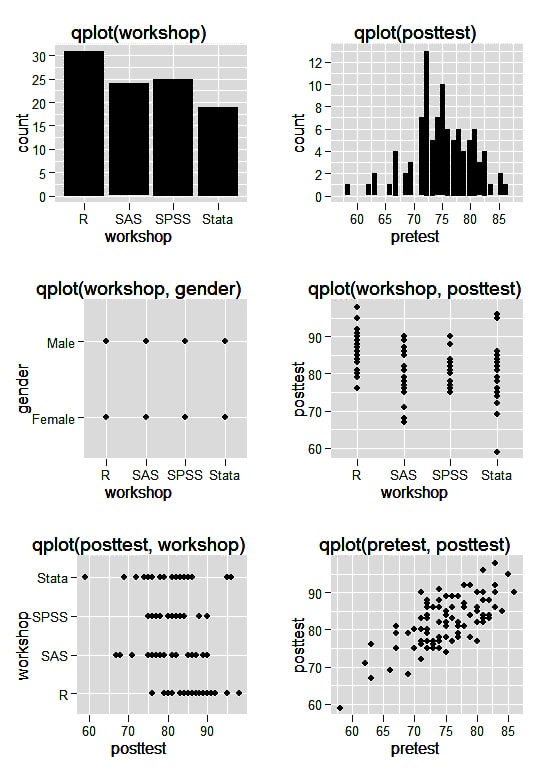
qplot ()-
This function mimics the conventional plot () of R in different ways by making itself easy for simple plots usage. Given below is a simple example of all default plots that the qplot () function makes-
Ggplot ()-
Unlike qplot(), ggplot() function uses grammar of graphics. Ggplot2 always plots with a call to the function ggplot (), supplying aesthetic mappings and default data, represented by aes(). Then layers, coords, scales and facets are added.
-
2) plotly
This is one among the best R packages to create interactive web-based graphs and beautiful data visualizations leveraging open source graphing library of JavaScript, plotly.js. Using htmlwidget framework, which allows various plots to work consistently and seamlessly in different contexts (such as shiny apps, any R command prompt, R markdown files and documents or in side RStudio) without using the internet connection.
C12 Energy is an independent oil and gas companies, working towards the way information flows. As the trillion-dollar company embark on the unmatched environmentally responsible outfield projects, the technology team of the company uses plotly.js to develop real-time data visualization, analysis-platform and acquisition. C12 captures industrial carbon dioxide emissions later using it for profitable oil recovery. By assembling the submitted data from field operators and data from automated acquisition systems, they drop it into plotly graphs- which help them discuss production issues that otherwise go unnoticed for days.
Plotly allows users to create various maps using the default Cartesian coordinate system by plotly. Since plotly.js can plot the scatter traces on a mapbox or custom geo layout as well. The figure below compares these 3 layouts in one subplot.
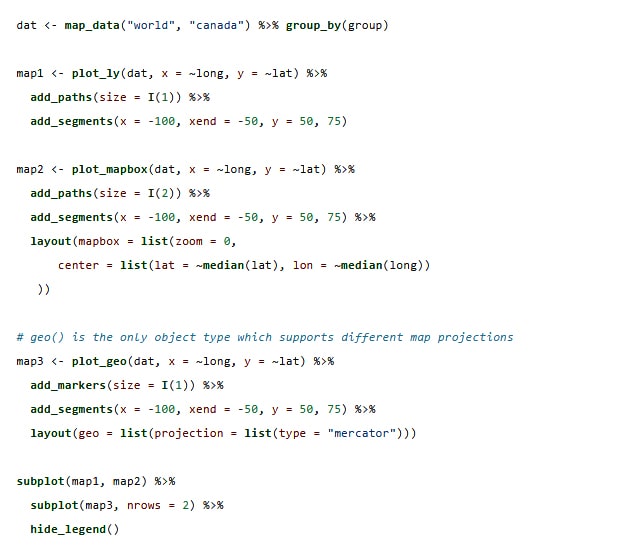
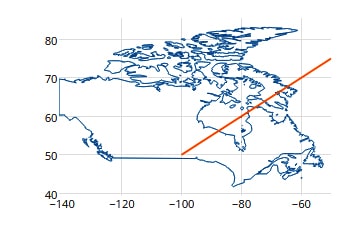
3 different ways to create a map. On the top left is default Cartesian coordinate system by plotly, on the top right is custom geo layout, and on the bottom, is mapbox.
-
3) ggvis
It is a data visualization package which lets users declaratively describe the graphics of data with a syntax identical to ggplot2. It also generates rich data graphics that you can use in your browser or locally in Rstudio. The goal of ggvis revolves around combining the best modelling functions of R with the web. It uses shiny’s infrastructure and network to publish efficient and interactive graphs that can be used from any browser across the globe. Data manipulation and transformation are performed in R, whereas, the graphics are later rendered in the web browser, leveraging Vega. On the other hand, for RStudio users, ggvis graphics are showcased in the viewer panel since RStudio is a web browser itself.
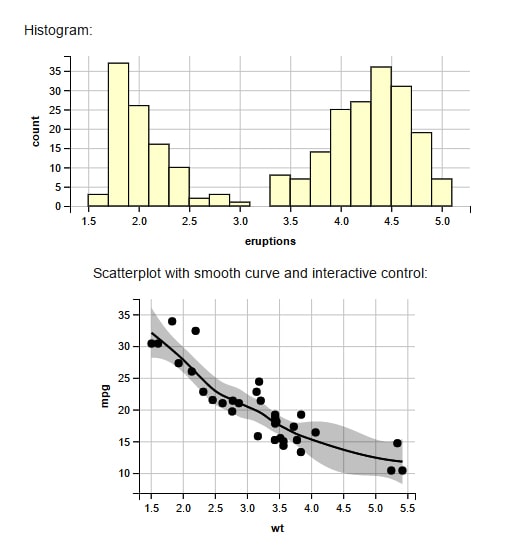
Mentioned below are some common examples of ggvis graphics-
The question, of course, is, which tool is the best for data visualization? A recent survey by O’Reilly media revealed that ggplot2 is the most widely-accepted tool for data visualization across the globe among employed professionals in data science - this study provides some evidence that suggest you should become an expert in it- if you are on the lookout for a data science career. We will admit that despite being the ‘most popular’ function according to researchers, ggplot2 has a bit of learning curve when you are setting out, but it becomes easier once you get it completely. The DASCA program for analysts covers this in great detail, and is a must-have in your data science CV. While learning data visualization by yourself won’t validate your skillsets, a certification will give you a foundation to move on to machine learning or other advanced visualization techniques!