When a data scientist begins to explore statistics for big data, the concepts transform her knowledge base used to solve a problem. This makes statistics an important area of study and research in the data science industry.
Employers look for statistical skills and knowledge in their prospective employees. They expect that the right reasoning is attached to the selection of a statistical tool for the processing of data. An in-depth study of these statistical tools reveals that probability is one of the most crucial and commonplace tools of all.
The blog explores how the knowledge of probability can help one gain a good job position. It shows how probability can help predict the future if the earth is taken as an arranged set of things and people. Statistical concepts also form a major part of data science interview questions and therefore prepare you for a better job prospect.
Important Applications of Probability in PredictabilityApplications of Probability in Data Science can help predict anything with good possibilities. The below-given points bring home these related assumptions. To understand, it becomes essential to believe that the world runs as a system, and things happen based on a number repetition or the real possibility of the number (to occur or to reoccur).
- Probability can become one of the essential tools to predict the future using data science applications. It can help define the chances of each possibility. Thus, it can even predict the percentage possibility of each reading. A number has some secret knowledge resulting in repetition or reoccurrence.
- If a system runs the universe, there need to be relationships between numbers and things, as seen as predictive ability. Also, it can be a fundamental error if one is convinced that the globe works on a random basis. For example: if the sky appears as rows of low, dark, and lumpy clouds, then, in this case, the weather is okay, but one is required to keep a watch for near-future developments. However, if there is a low, dark, and grey sheet, then, in this case, it is probably raining. Thus, humans by studying the sky can predict rain, and it is all a scientific method by which the probability of rain can be calculated. Only a system running can confirm this to be so. Thus, even numbers have to repeat or originate as new as per a set system, which can be calculated or known as per the in-depth and detailed study of probability in numbers.
- To find number relations, one can make use of probability. Thus, probability can find connections between the past and the future. Therefore, it helps predict the future with proper reasoning as well, in many cases.
- Application of average, mean, mode to find relations for the possibility or probability can also be a good idea.
- Probability thus can cover a vast area of applicability in data science industry.
- In future it can also hold a good level of significance in machine learning algorithms.
1. Conditional Probability (Bayes Theorem)
Bayes theorem can be defined as a conditional probability statement, which appears to be the probability of event B to occur due to event A which has already taken place.
Half-knowledge cannot always be wrong, especially if it works to predict the future of the remaining half.
Knowledge, after all, cannot be bad. In the Probability Distributions, this half-knowledge of Conditional Probability, if applied, can result in better predictive ability. Perhaps, it can act as the data on which Probability Distribution is based in many cases.

Figure 1: Bayes Theorem Equation
2. Probability Distributions
A probability distribution is a simple way to know the probability of all possible outcomes that can be obtained in an experimental study. It is an important statistical function of probability used frequently in the data science industry. There are several types of probability distribution and here we discuss a few of the important ones.
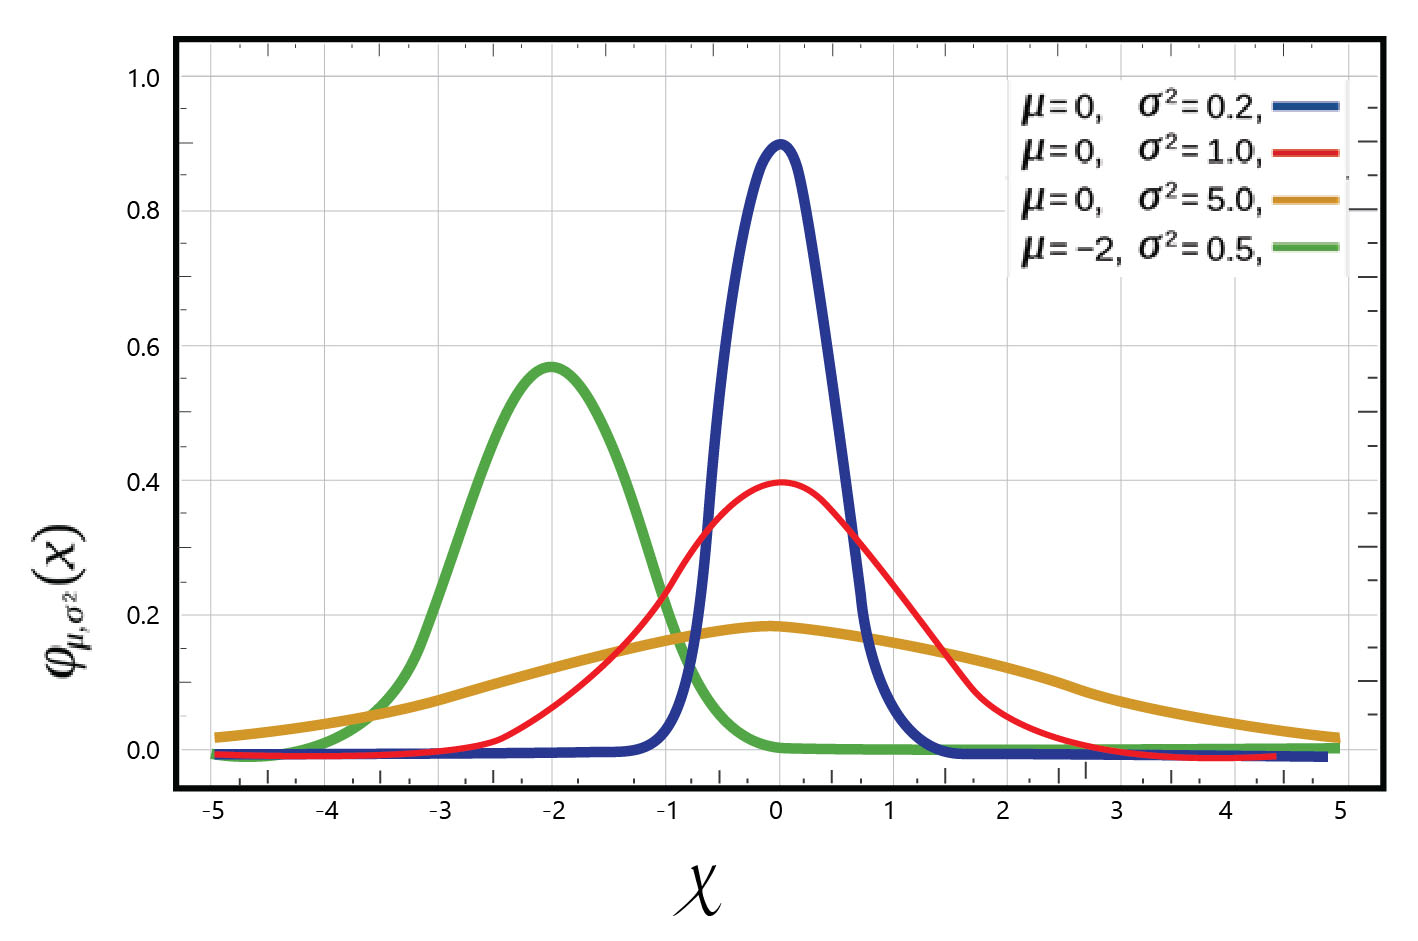
Normal Distribution: Gaussian distribution is also called as the normal distribution. It is a bell-shaped curve that is very clearly seen in several types of distributions. For example: IQ scores and height of the people
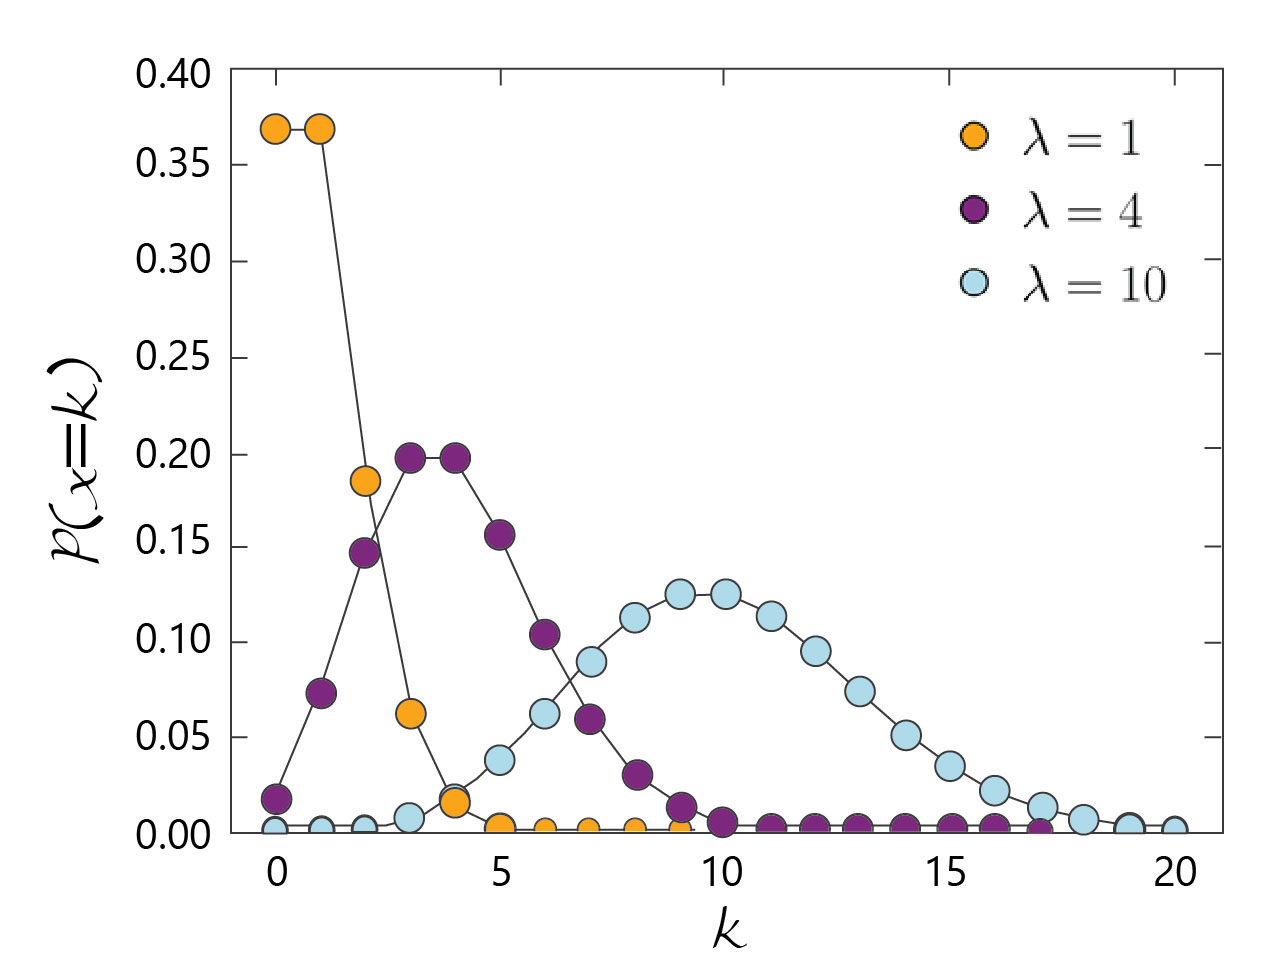
Poisson Distribution: It is a discrete distribution that provides the probability value of the number of independent events that takes place in a fixed time period.
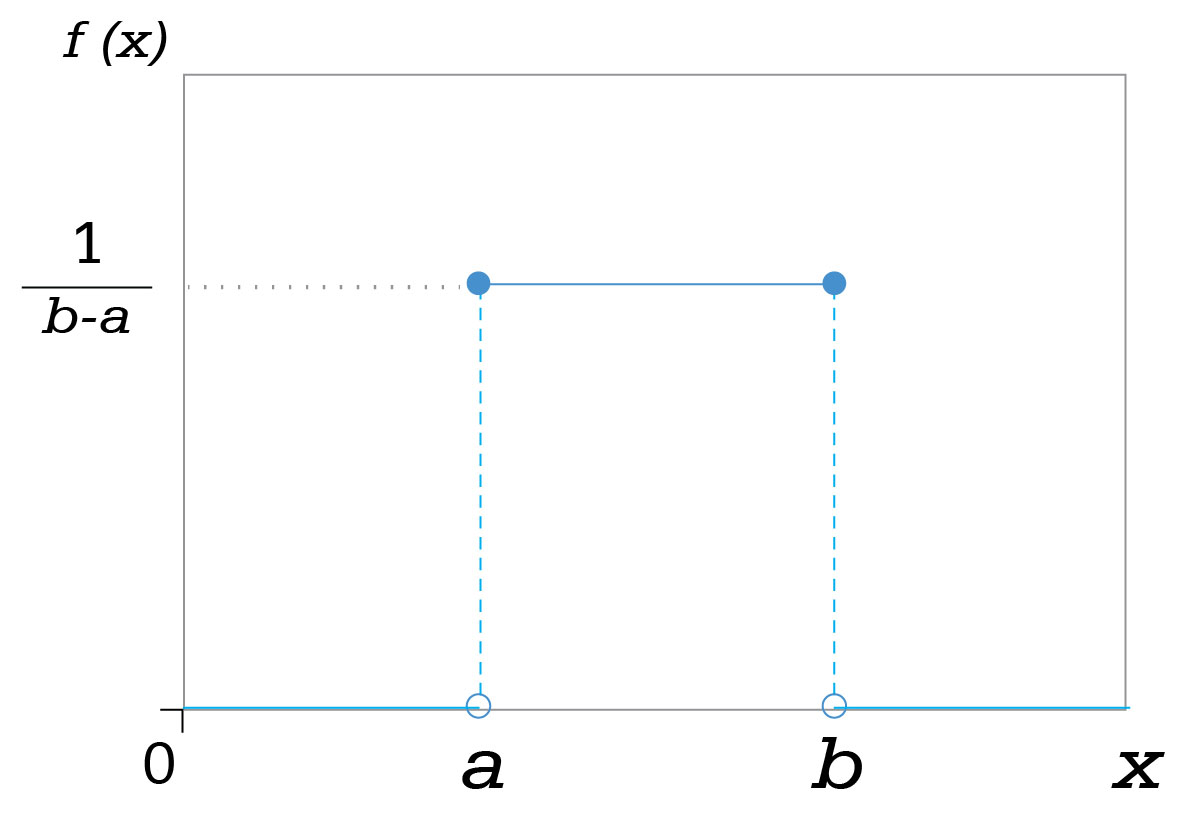
Uniform Distribution: It is used when all outcomes have equal chances of happening. For example, a coin has uniform distribution.
3. Sampling techniques
The method by which a sample is selected as the experimental group is defined as the sampling technique. It is of different types with each having its own advantages and disadvantages. There exist five major ways by which one can sample data. They are as given below:
Simple Random Sampling: It requires the application of numbers generated randomly to select a sample.
Systematic Sampling: It is even more simple a method than the first one. This one takes one element from the sample and then skips n (predefined amount) and then again takes the next element.
Convenience Sampling: It takes a sample that is easy to get in touch with or get responses from a group. In this, the sample comprises of the first set of people one gets to initiate contact with. It is, therefore, discouraged in practice.
Stratified Random Sampling: It begins by dividing the population into groups with similar attributes. Next, a random sample is taken from each group. It helps to ensure that varying segments in a population are representing equally.
Cluster Sampling: It begins with dividing the population into clusters or groups. It is different such that each cluster can be considered as the representative of the entire population.
4. Confidence Intervals and Hypothesis Testing
Confidence intervals and hypothesis testing are closely related. The confidence level shows a range for an unknown parameter and is later linked to the confidence level. Thus, stating that the true parameter is present within the suggested range of confidence interval. These calculations are particularly important in medical and pharmaceutical research, and they provide researchers with a better basis for the calculations, estimations. It can also be linked to the improved predictive ability of probability.
Hypothesis testing lays the ground of experimental questions, and testing proves that something has not happened just by chance. Thus, probability of its happening is there, and there is some good reason attached to this possibility, and this probability is not only by chance.
5. P-Values
One of the precise and technical meanings of a p-value is that it is the probability of obtaining an “extreme result,” as stated by the null hypothesis when true.
A p-value (also called probability value) is the probability for the null hypothesis, knowing whether a theory under test is false. If the p-value is less than 0.05, then it can be concluded that it is not possible that the null hypothesis is true, and thus it indicates that the research has significant statistical value.
However, if the p-value is more than 0.05, then it can be concluded that the null hypothesis is true are high, thus the lower statistical significance of the experiment. It can be stated that p-value adds more reasoning and logic to the understanding of the Probability Distributions. Thus, the probability, if also applied by p-value knowledge, can further enrich the predictability concerning accuracy.
Wrapping upThe above statistical concepts, that is, conditional probability, probability distribution, sampling techniques, confidence development and hypothesis testing, and p-value, are of great value in preparing for the data science interview phase. These concepts' significance also lies in coming up with novel ways to understand and solve practical problems through data. It is also useful in predicting the future related to industrial design, numerical structure inputs, and big data.


