Data science is like solving a giant puzzle, turning raw data into insights that drive decisions. Whether you’re predicting customer behavior or analyzing trends, a clear data science workflow is your roadmap to success. The data science process breaks complex projects into manageable steps, helping you stay organized and deliver reliable results. For beginners and pros alike, mastering the data science workflow is key to thriving in this fast-growing field.
In this article, we’ll walk you through the data science workflow, covering popular frameworks like ASEMIC, CRISP-DM, and OSEMN. Let’s get started!
What is a Data Science Workflow?
A data science workflow is a set of steps that guide a data science project from start to finish. It’s like a recipe for baking a cake—you follow a sequence to ensure the final product is delicious. The data science process organizes tasks like collecting data, cleaning it, analyzing it, and sharing results, making projects easier to manage and reproduce.
There’s no one-size-fits-all data science workflow, as each project varies by data and goals. However, frameworks like ASEMIC, CRISP-DM, and OSEMN provide structured approaches. These workflows are iterative, meaning you often revisit steps to refine results, much like a detective revisiting clues to solve a case.
Why the Data Science Workflow Matters
The data science workflow is critical for several reasons:
- Clarity: It provides a roadmap, keeping teams focused on goals.
- Reproducibility: Structured steps make it easier to repeat experiments.
- Collaboration: Workflows help team members understand tasks and contribute.
- Efficiency: Organized processes save time and reduce errors.
- Impact: Clear results drive better business decisions.
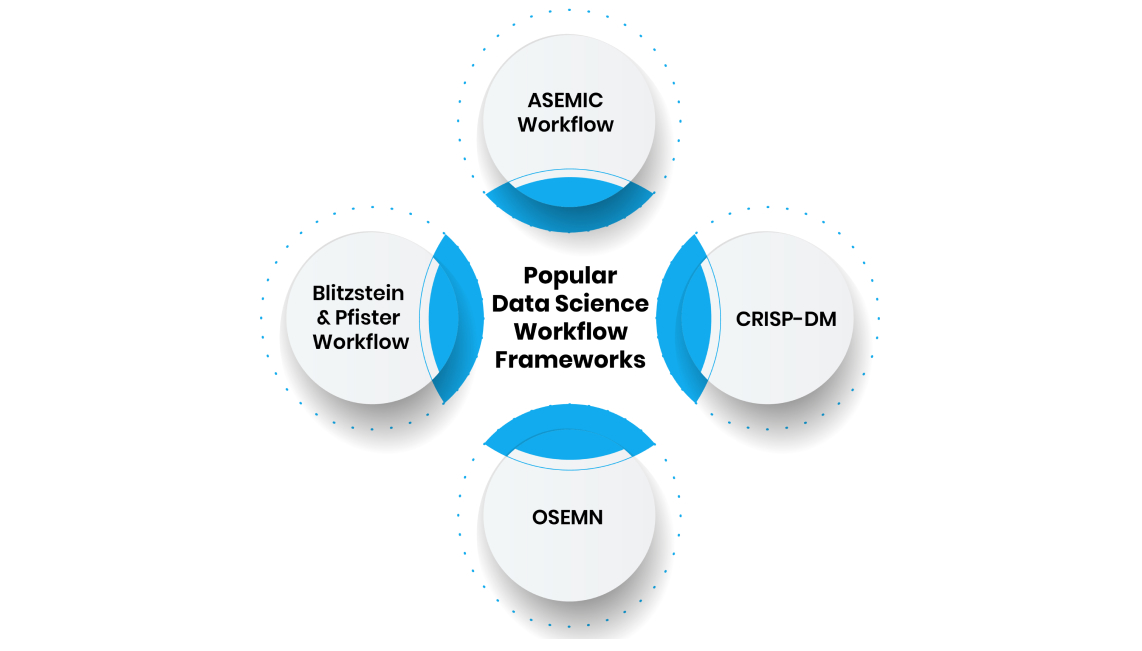
Popular Data Science Workflow Frameworks
Several frameworks guide the data science workflow. Here are the top ones:
1. ASEMIC Workflow
ASEMIC (Acquire, Scrub, Explore, Model, Interpret, Communicate) is a flexible framework inspired by OSEMN, designed for typical data science projects:
- Acquire: Collect raw data from sources like databases or APIs.
- Scrub: Clean data by fixing errors, missing values, or outliers.
- Explore: Analyze data with visualizations and statistics to find patterns.
- Model: Build machine learning models to predict or classify.
- Interpret: Understand model results in the context of the problem.
- Communicate: Share findings with stakeholders through reports or dashboards.
Example: A marketing team uses ASEMIC to analyze customer data, acquiring it from CRM, cleaning it, exploring purchase trends, modeling churn, and presenting insights.
2. CRISP-DM
CRISP-DM (Cross-Industry Standard Process for Data Mining) is a circular, industry-focused framework:
- Business Understanding: Define the problem and goals.
- Data Understanding: Explore data quality and structure.
- Data Preparation: Clean and format data.
- Modeling: Build and test models.
- Evaluation: Assess model performance.
- Deployment: Implement and monitor models.
Example: A bank uses CRISP-DM to detect fraud, defining fraud patterns, preparing transaction data, modeling anomalies, and deploying alerts.
3. OSEMN
OSEMN (Obtain, Scrub, Explore, Model, iNterpret) is a linear yet iterative framework:
- Obtain: Gather data from sources like CSV files or web scraping.
- Scrub: Clean messy data for analysis.
- Explore: Use visualizations to understand data.
- Model: Apply machine learning algorithms.
- iNterpret: Explain results and their implications.
Example: A startup uses OSEMN to analyze user feedback, obtaining reviews, scrubbing typos, exploring sentiments, modeling satisfaction, and interpreting trends.
4. Blitzstein & Pfister Workflow
This framework, from Harvard’s CS 109 course, focuses on five phases:
- Ask an interesting question.
- Get the data.
- Explore the data.
- Model the data.
- Communicate and visualize results.
Example: A sports team uses this workflow to analyze player performance, asking about key metrics, collecting stats, exploring trends, modeling predictions, and sharing insights.
These frameworks show the data science process is adaptable, letting data scientists choose the best fit for their project.
Steps in a Data Science Workflow
Based on the frameworks, here’s a step-by-step guide to the data science workflow, blending ASEMIC, CRISP-DM, OSEMN, and other insights:
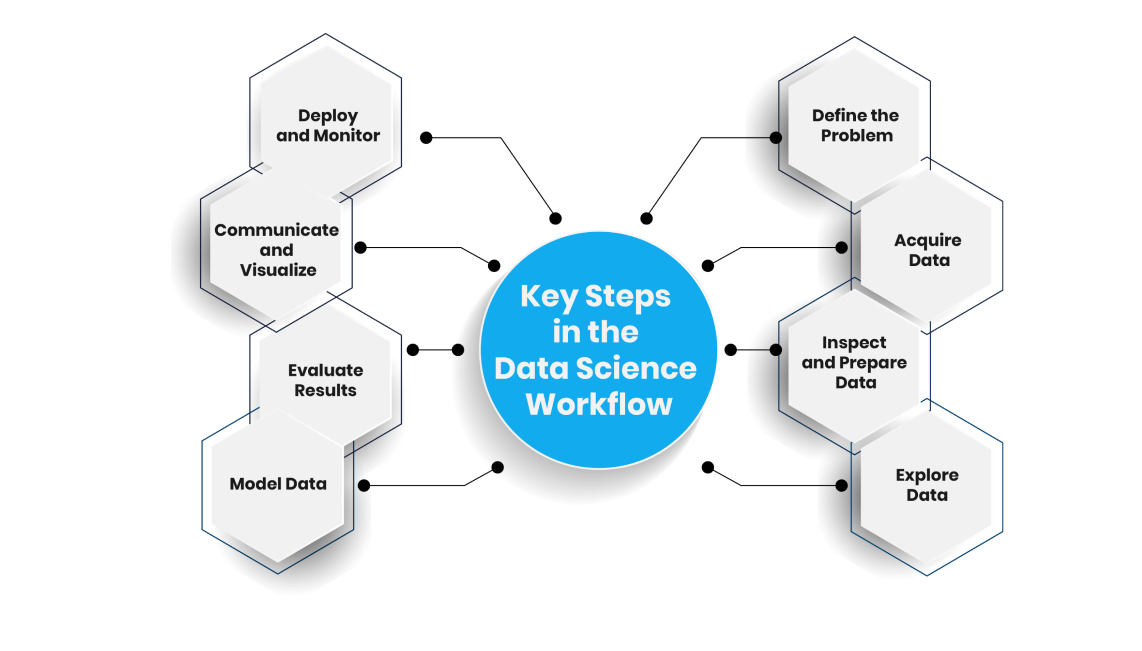
Step 1: Define the Problem
Start by understanding the business goal. Ask:
- What problem are we solving?
- What insights do we need?
- How will results help the business?
This step guides the entire data science process, ensuring focus.
Step 2: Acquire Data
Collect data from sources like:
- Databases (SQL servers).
- Public datasets (e.g., UCI Repository).
- Web scraping (e.g., product reviews).
- APIs (e.g., Twitter data).
- CSV files or software logs.
Step 3: Inspect and Prepare Data
Raw data is often messy. This step involves:
- Inspection: Check for missing values, outliers, or incorrect data types. Use statistical tests or visualizations like histograms.
- Preparation: Clean data by removing errors, imputing missing values, or scaling features. Transform data into a model-ready format.
Step 4: Explore Data
Dive into the data to find patterns using:
- Exploratory Data Analysis (EDA): Create histograms, scatter plots, or correlation heatmaps.
- Hypotheses: Test ideas about data relationships (e.g., does page load time affect cart abandonment?).
- Problem Type: Identify if it’s supervised (classification/regression) or unsupervised (clustering).
Step 5: Model Data
Build machine learning models based on the problem:
- Select Algorithms: Use regression for continuous outputs (e.g., sales prediction) or classification for discrete labels (e.g., churn).
- Train Models: Fit models on training data.
- Validate: Test models on separate data to ensure generalization.
Step 6: Evaluate Results
Assess model performance using metrics like:
- Accuracy, precision, recall, or F1-score for classification.
- Mean squared error for regression.
- Compare multiple models to pick the best.
Step 7: Communicate and Visualize
Share findings with stakeholders through:
- Reports, dashboards, or presentations.
- Visualizations like charts or heatmaps.
- Clear explanations tailored to non-technical audiences.
Step 8: Deploy and Monitor
Implement the model in production and monitor performance:
- Deploy via web apps (e.g., Streamlit) or APIs.
- Monitor for data drift or degrading accuracy.
- Update models as new data arrives.
These steps make the data science workflow actionable, ensuring success in data science projects.
Case Study: Predicting Iris Flower Species
Let’s apply the data science workflow to a real project using the Iris dataset, a classic data science dataset with 150 samples of iris flowers, measuring sepal and petal dimensions to predict species (Setosa, Versicolor, Virginica).
Step 1: Define the Problem
Goal: Build a model to predict iris species based on measurements.
Step 2: Acquire Data
Import the Iris dataset from the UCI Repository using Pandas:
import pandas as pd
url = 'https://archive.ics.uci.edu/ml/machine-learning-databases/iris/iris.data'
col_names = ['Sepal_Length', 'Sepal_Width', 'Petal_Length', 'Petal_Width', 'Species']
iris_df = pd.read_csv(url, names=col_names)
Step 3: Inspect and Prepare Data
Inspect with:
iris_df.info() # Check data types, null values
iris_df.hist() = # Visualize distributions
Findings: No null values, but species are categorical. Prepare by encoding species and scaling features:
from sklearn.preprocessing import LabelEncoder, StandardScaler
le = LabelEncoder()
iris_df['Species']= le.fit_transform(iris_df['Species'])
scaler = StandardScaler()
iris_df_scaled = scaler.fit_transform(iris_df.drop(columns=['Species']))
Step 4: Explore Data
Create scatter plots and a correlation heatmap:
import seaborn as sns
import matplotlib.pyplot as plt
sns.scatterplot(x='Sepal_Length', y='Petal_Length', hue='Species', data=iris_df)
sns.heatmap(iris_df.corr(), annot=True, cmap='coolwarm')
plt.show()
Insights: Setosa is linearly separable; petal features are highly correlated.
Step 5: Model Data
Train an SVM classifier:
from sklearn.model_selection import train_test_split
from sklearn.svm import SVC
X = iris_df_scaled
y = iris_df['Species']
X_train, X_val, y_train, y_val = train_test_split(X, y, test_size=0.3)
model= SVC(kernel='linear', C=1)
model.fit(X_train, y_train)
Step 6: Evaluate Results
Check accuracy and metrics:
from sklearn.metrics import accuracy_score, classification_report
y_pred = model.predict(X_val)
print("Accuracy:", accuracy_score(y_val, y_pred) * 100)
print(classification_report(y_val, y_pred))
Result: 97.7% accuracy, excellent precision and recall.
Step 7: Communicate and Visualize
Build a Streamlit app to display predictions:
import streamlit as st
st.title("Iris Species Prediction")
sepal_length = st.slider("Sepal Length", 4.0, 8.0)
# Add sliders for other features
features scaler.transform([[sepal_length, sepal_width, petal_length, petal_width]])
prediction = model.predict(features)
st.write(f"Predicted Species: {le.classes_[prediction[0]]}")
Step 8: Deploy and Monitor
Save the model with Pickle and deploy on Streamlit Sharing:
import pickle
with open('model.pkl', 'wb') as file:
pickle.dump ({'model': model, 'scaler': scaler, 'le': le}, file)
Monitor predictions for accuracy over time.
This case study shows how the data science workflow delivers reliable results in a real data science project.
Best Practices for Data Science Workflows
To excel in the data science process, follow these tips:
1. Document Every Step
Recording every action in your data science workflow ensures you can retrace your steps, understand past decisions, and share your process with others. Without documentation, you might forget why you chose a specific algorithm or how you cleaned the data, leading to confusion later.
Use Jupyter Notebooks to blend code, visualizations, and notes in one place. Write comments in your code to explain what each line does, like why you dropped a column or scaled a feature. Create a README file in your project folder to outline the project’s goals, steps, and tools. For team projects, store notes in shared platforms like Google Docs or Notion to keep everyone informed.
Consider adding version numbers or dates to your documentation, like “2025-06-13_data_cleaning.md,” to track changes. Use GitHub to store and version-control your notes, ensuring they’re accessible and secure.
2. Organize Your Project Files
A tidy project folder is essential for an efficient data science workflow. Disorganized files can lead to mistakes, like using the wrong dataset, or slow down collaboration.
Separate your files into distinct categories. For data, create subfolders:
- Raw: Store untouched data, like CSV files from a database, to preserve the original source.
- External: Keep data from APIs or public datasets, like Kaggle, in its original form.
- Interim: Save partially cleaned or merged data, like after removing duplicates.
- Processed: Store final, model-ready data after scaling or encoding.
For models, save trained machine learning models as .pkl files for reuse in predictions or comparisons. Place notebooks in subfolders like “eda” for exploratory analysis and “experiments” for model prototypes to avoid clutter. Keep source code in a “src” folder, with scripts for tasks like data retrieval or feature engineering.
3. Automate Data Pipelines
Manually collecting and cleaning data is slow and risky, especially with large or frequent updates. Automating data pipelines in your data science workflow ensures consistent, error-free data flow, letting you focus on analysis and modeling.
Tools like Hevo simplify this by connecting to over 150 sources, including databases, SaaS apps, and cloud storage, and loading data into destinations like BigQuery or Snowflake. Hevo’s no-code interface lets you set up pipelines without complex coding, and its automatic schema mapping handles changes in data structure. Schedule syncs to keep data fresh, like daily updates from a CRM. A retail data scientist might use Hevo to pull customer purchase data from Shopify into Redshift, automating what used to take hours of manual exports.
If you need custom automation, write Python scripts with Pandas for data cleaning or SQLAlchemy for database queries. Test pipelines with small datasets to catch issues early. Automation makes your data science process scalable, handling big data with ease and supporting real-time insights.
4. Track Your Experiments
Data science projects involve testing many models and settings, which can get messy without proper tracking. Keeping a log of experiments in your data science workflow helps you compare results, choose the best model, and avoid repeating mistakes.
Use neptune.ai to record each experiment’s details, like dataset version, algorithm, hyperparameters, and metrics such as accuracy or F1-score. Save visualizations, like confusion matrices, and model files alongside logs for easy reference.
If neptune.ai isn’t an option, use spreadsheets to track metrics or Python scripts to save results as JSON files. Name experiments clearly, like “exp_2025-06_xgboost_v1,” for quick identification. Tracking ensures your data science process is systematic, helping you make data-driven decisions.
5. Collaborate with Your Team
Data science thrives on teamwork, combining skills from data scientists, engineers, and business stakeholders. Sharing your data science workflow keeps everyone aligned, ensuring projects run smoothly and deliver value.
Use GitHub to share code and workflows, letting teammates review scripts or notebooks. Set up Jira or Trello boards to assign tasks, like data collection or model evaluation, and track progress. Hold weekly meetings to discuss findings, like unexpected data patterns, and plan next steps. For non-technical stakeholders, create dashboards with Streamlit or Tableau to present insights visually.
6. Review Projects with Post-Mortems
After completing a data science project, take time to reflect on what worked and what didn’t. Post-mortems improve your data science workflow by identifying issues, like slow processes or weak models, and planning fixes for future projects.
Gather your team to discuss the project openly. Ask: Did we define the problem clearly? Were tools effective? Did stakeholders understand the results? Document answers in a shared report, noting successes (e.g., high model accuracy) and challenges (e.g., missing data). A data scientist team reviewing a delayed inventory forecasting project might find manual data uploads caused bottlenecks, deciding to use Hevo for automation next time.
Create action items, like testing new tools or refining problem definitions, and assign owners. Store post-mortem notes in Google Docs or Notion for reference. Schedule reviews soon after project completion to capture fresh insights.
Tools for the Data Science Workflow
These tools streamline the data science workflow:
- Data Ingestion: Hevo for automated pipelines.
- Data Manipulation: Pandas for cleaning and preparation.
- Visualization: Matplotlib, Seaborn for EDA.
- Modeling: scikit-learn, TensorFlow for machine learning.
- Experiment Tracking: neptune.ai for model comparison.
- Deployment: Streamlit for web apps, Docker for containers.
- Notebooks: Jupyter for interactive analysis.
Challenges and Solutions
The data science process has hurdles:
- Messy Data: Spend time cleaning with Pandas or automate with Hevo.
- Reproducibility: Document steps and use version control (Git).
- Team Alignment: Define roles and use shared workflows.
- Scalability: Use Docker for consistent environments across large teams.
Future Trends in Data Science Workflows
The data science workflow is evolving:
- MLOps: Integrates DevOps for automated model deployment
- AutoML: Tools like Google AutoML simplify modeling.
- Real-Time Analytics: Workflows will prioritize live data with tools like Hevo.
- Collaboration Tools: Platforms like neptune.ai enhance team workflows.
For data scientists, staying updated ensures your data science process remains cutting-edge.
Conclusion
Mastering the data science workflow is essential for success in data science. Frameworks like ASEMIC, CRISP-DM, and OSEMN provide structure, while tools like Hevo, Streamlit, and Docker streamline the data science process. By defining problems, acquiring data, exploring patterns, modeling, evaluating, and communicating results, data scientists can deliver impactful insights. The iterative nature of workflows ensures flexibility, making them adaptable to any project.
Start your data science journey today with a simple project and a clear workflow.


