


Selecting the right analytical tool helps you discover valuable insights that guide efficient business decisions. How to do different tasks continues to be affected by the ongoing SQL vs. Excel debate among the primary data analyst tools. Recognizing what works best and what doesn’t with these tools allows analysts to smooth their workflows, reduce mistakes, and boost results using data. This article explores SQL and Excel for data analysis, with clear comparisons made by considering context and application.
How SQL and Excel Function as Essential Data Analyst Tools
Data analysis uses SQL and Excel to cover the fundamentals of processing and understanding data. SQL is a valuable language for working with data in relational databases. Analysts can quickly handle complicated operations because the database pulls detailed, accurate information from big, structured data.
On the contrary, Excel is used by many to manage, adjust, and display information as tables and charts. Because the software is user-friendly and offers many options, anyone from a trainee to a full analyst can use it comfortably. Excel helps to explore and display data easily and quickly, whereas SQL guarantees efficient handling of larger amounts of data and ensures its accuracy.
Key distinctions include:
- Data Structure and Scale: SQL processes data sets kept in databases, efficiently managing millions of records. Excel performs well with a maximum of one million lines, but working with larger files will reduce performance.
- Automation and Repeatability: Storing and automating SQL queries makes consistent analysis possible. Excel tasks frequently depend on people doing them by hand, which increases the opportunity for errors.
- Data Integrity and Security: SQL allows only proper data validation and secure access to database information. Changes to Excel files can happen by error, and there is no internal database-level security.
- User Accessibility: Excel's interface makes it easy to handle data, but SQL requires knowledge of constructing and enhancing queries.
Core Strengths of SQL for Data Analysis
Data analysts who use relational databases rely on SQL as a fundamental tool. Its capacity for working with and managing vast datasets is the reason for it to be the central to current data operations. Compared to other manual tools, SQL makes it possible to work with massive datasets that are just as accurate and perform smoothly.
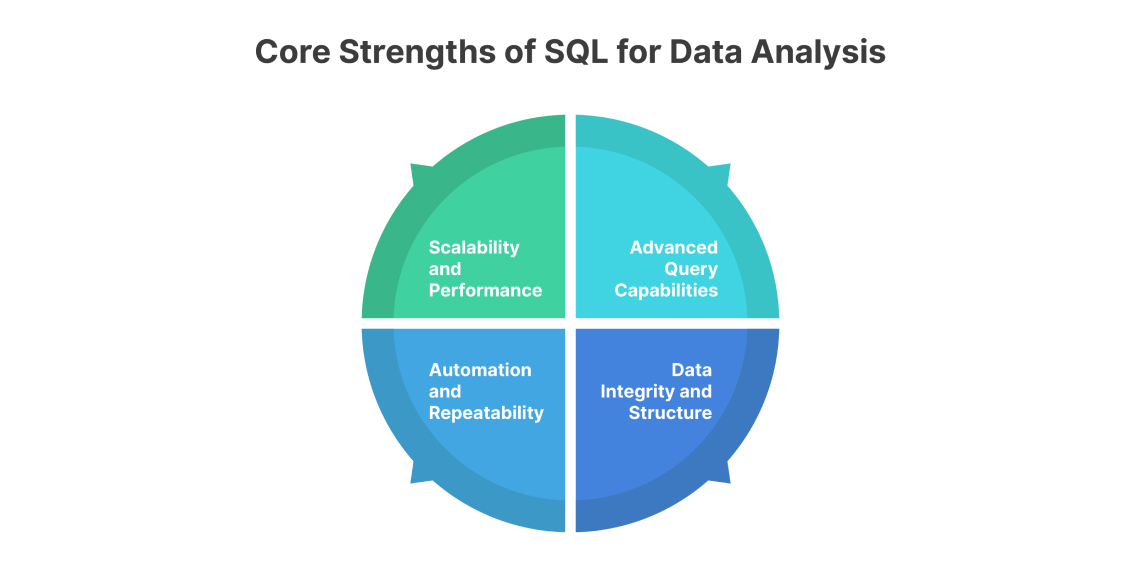
- Scalability and Performance: SQL is designed to handle a wide range of organized data. When working with severe enterprise-sized data, data analysts can carry out complex operations without experiencing delays.
- Advanced Query Capabilities: SQL makes it easy to work with data in complex ways using the GROUP BY, HAVING, CASE, and subquery functions. These functions help make SQL suitable for studying data sets with different layers and related factors.
- Automation and Repeatability: SQL scripts make it easy to reuse and modify code, which keeps things consistent and prevents errors. Creating reports with the same logic and layout is very helpful when you repeat them regularly.
- Data Integrity and Structure: SQL databases define structures, types of data, and rules that reduce repeating information and help maintain high data quality, which is essential for reliable analysis and choices.
Core Strengths of Excel for Data Analysis
The software remains highly accessible and is often selected for immediate learning tasks, flexible data exploration, and simple data visualization. Its simple design allows people from various disciplines to analyze data without complex coding. Excel is well-suited for fast and flexible workplaces, since it is customized for simple interaction.
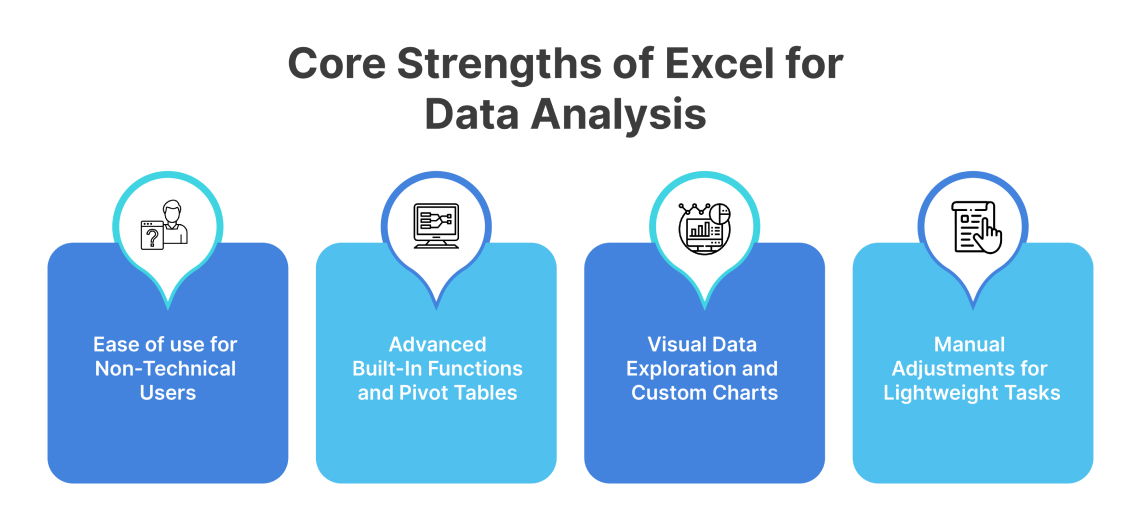
- Ease of Use for Non-Technical Users: The grid structure and way of using formulas in Excel make it simple for anyone to learn. Those without coding knowledge can use Tableau to look at data, build assorted charts, and run various functions with little training.
- Advanced Built-In Functions and Pivot Tables: Excel has several built-in functions and pivot tables that help you easily summarize, sift through, and reshape your work data. For small—to mid-sized datasets, it is straightforward to recognize and compare different patterns.
- Visual Data Exploration and Custom Charts: Excel has functions that make it easy for users to create clear charts from raw data. These data visualization tools help make data stories detailed and easy to understand.
- Manual Adjustments for Lightweight Tasks: Excel easily handles data for one analysis or investigation. This works well when the data is small, requires little preparation, or has observational tags.
When to Use SQL vs. Excel: Scenario-Based Analysis
Choosing SQL or Excel for analyzing data largely depends on the type of data, the specific assignment, and the place where the work is being done. Specific tools are needed depending on how much data you have, how you want to collaborate, and what you want to analyze.
- Data Volume and Complexity: If the dataset is more than 100,000 rows long or if you need to join many tables, use SQL. Completing optimized queries makes SQL perfect for relational databases, where accuracy and quick response time are most valued. While Excel can perform many tasks, it performs inefficiently and is unreliable when dealing with large amounts of data.
- Ad Hoc and Exploratory Analysis: Excel is best for quickly seeing and exploring your data if you use charts. This interface allows Users to make swift charts, sort through data, and format desired results. It’s also useful because you can use it to create dashboards or solve short-term questions that don’t require coding.
- Collaboration and Version Control: SQL is designed to support and structure team projects. By having stored procedures, access permissions, and audit trails, everyone can work on shared data clearly and consistently. Sharing an Excel file with others can create problems with mismatched copies and duplications.
- Real-Time and Dynamic Data Access: SQL enables live data from databases because it communicates and updates directly. Working with Excel often involves setting things up manually or importing data independently, which takes extra time.
Limitations and Challenges of SQL and Excel in Data Analysis
Although SQL and Excel are basic data analysis tools, their weaknesses may affect their usefulness depending on what you need to do or where the data comes from. Despite being capable, SQL depends on well-organized data and understanding how database languages work. The technical aspect makes working with this tool harder for some analysts. Preferring SQL for quick changes to data is difficult, since it lacks the flexibility and graphic tools of other relational query languages.
- Scalability vs. Usability Trade-off: SQL is especially suited for processing extensive data, but you need experience and proper access to a database. At the same time, using Excel is straightforward, yet it struggles to handle many rows without crashing or slowing down.
- Risk of Human Error in Excel: Data errors can be caused by manual typing, copying, and unnoticed changes in your spreadsheet; studies show that 88% of spreadsheets contain mistakes.
- Automation and Version Control Limitations: Excel’s automation and version control limitations make it difficult to reproduce results or cooperate reasonably on complex analyses, unlike working with SQL scripting languages.
Complementary Use of SQL and Excel: Integrating Strengths
People see SQL and Excel as separate alternatives, but this is not always true. Many data analysts use machine learning and artificial intelligence better, with each technology adding value to real projects. By combining these approaches, we improve the accuracy, effectiveness, and clarity.
- SQL for Data Extraction, Excel for Analysis: SQL functions best when extracting extensive data sets straight from relational databases. After the data has been filtered, cleaned, and compiled, it can be exported to Excel to be adequately examined or prepared for a report. Hence, analysts no longer have to collect data manually.
- Streamlined Import/Export Workflows: Importing SQL results with Excel’s data connectors or ODBC links makes it easy to move from working with queries to working with spreadsheets. Consequently, users can analyze unaltered information and still use Excel to display everything on a dashboard.
- Enhanced Visual Interpretation: Excel proves valuable since SQL does not provide a way to display results visually. Many analysts rely on SQL to generate the logic and use Excel to display this information clearly for decision-makers.
- Version Control and Documentation: Documenting your work with SQL is easy to reproduce and quickly updated, while you can easily add notes and collect summaries in Excel. Both are useful, and when drawn upon at once, they give you both solid arguments and clarity in presentations.
Conclusion
Picking SQL or Excel depends on how big your data is, how involved it is, and what you want to do with the data. A data analyst can rely on SQL for large data and automation and Excel for quick understanding and usage. Knowledge of both makes it easy for analysts to respond to a wide variety of projects. Looking at the data and how it is managed can guide you in using the right tool for data analysis and maintaining high accuracy.