


Hypothesis testing is a statistical method that allows data scientists to make quantifiable, data-driven decisions. By setting up two mutually exclusive hypotheses, the null and alternative, we can conduct experiments to determine which one is supported by the sample data.
This fundamental technique is the backbone of many data science workflows, facilitating objective decision-making backed by rigorous statistical analysis rather than intuition or anecdotes.
In this article, we’ll cover the basics of hypothesis testing, its role in data science experimentation, various types of hypothesis tests, common errors to avoid, and some real-world examples across industries.
What is Statistical Hypothesis Testing?
In simple terms, Statistical hypothesis testing refers to the systematic procedure of making assumptions about a population parameter based on sample data observations. It allows us to test claims, theories, or beliefs about data to determine if there is enough evidence to support them statistically.
The typical hypothesis testing process involves:
- Establishing a null hypothesis and an alternative hypothesis
- Setting a significance level
- Calculating a test statistic from sample data
- Comparing the test statistic value against critical values to determine statistical significance
- Making a data-backed decision to either reject or fail to reject the null hypothesis
This structured approach of hypothesizing, experimenting, and validating concepts enables disciplined decision-making backed by cold hard facts rather than hunches or intuitions.
Understanding Key Terminologies
To gain a solid grasp of hypothesis testing, familiarizing yourself with its related terminologies is crucial:
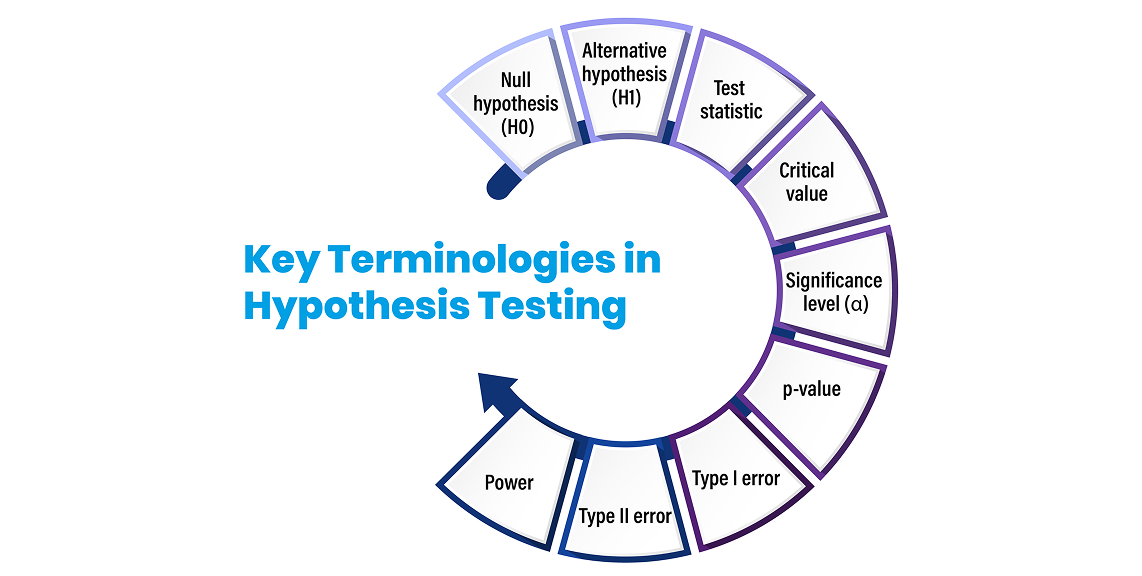
- Null hypothesis (H0): Default position that states no significant effect/relationship exists in the data.
- Alternative hypothesis (H1): Contrasting hypothesis that a significant effect/relationship does exist.
- Test statistic: Metric calculated from sample data to determine whether to reject the null hypothesis.
- Critical value: Thresholds indicating statistical significance, derived from the desired significance level.
- Significance level (α): Probability threshold indicating strong evidence against the null hypothesis, usually 0.05.
- p-value: Probability of obtaining test results as extreme as observed if H0 is true. Small p-values suggest strong evidence against H0.
- Type I error: Incorrectly rejecting a true H0 (false positive).
- Type II error: Failing to reject a false H0 (false negative).
- Power: Probability of correctly rejecting H0 when H1 is true.
These parameters encapsulate the essence of hypothesis testing and enable sound statistical decision-making during data analysis.
The Role of Hypothesis Testing in Data Science Experiments
Hypothesis testing in data science aims to establish causality as opposed to just correlations – determining how changes in one variable directly impact another variable. Hypothesis testing provides the backbone for designing such experiments in a methodical manner and deriving statistically-validated inferences. The typical workflow is:
- State the null and alternative hypotheses
- Determine suitable sample sizes, data to collect
- Analyze data, calculate test statistics like t-test or chi-square
- Compute the p-value
- Make data-driven decisions at the chosen significance level (usually 0.05)
By embedding hypothesis testing into data science experiments, data scientists can ensure that their causal determinations are supported by statistical rigor rather than hasty assumptions.
Types of Hypothesis Tests
Based on the hypotheses, data type and analysis required, data scientists have a variety of test statistics and methods at their disposal, including:
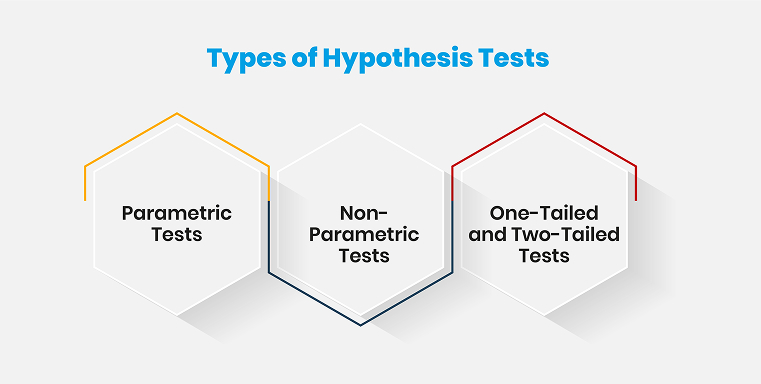
Parametric Tests
Parametric tests make assumptions about the distribution of data based on the parameters of that distribution, such as the mean and standard deviation in the case of a normal distribution.
Some examples of parametric hypothesis tests include:
- Z-tests: Used when the population parameters (mean and standard deviation) are known. The test statistic follows a standard normal distribution which allows testing against critical values from the normal distribution. Commonly used for testing the mean of a population.
- T-tests: Used when population parameters are unknown and sample size is small. The test statistic follows a t-distribution. Includes one-sample, two-sample, and paired variants. Used for comparing means between groups or against a known value.
- Analysis of Variance (ANOVA): Used for testing differences in means across multiple groups. Various versions exist for different experimental designs (one-way, two-way, repeated measures etc.). The F-statistic compares variability between and within groups.
Parametric tests provide more statistical power when their assumptions are met. However, they are sensitive to deviations from assumptions like normality. Data transformations may be required in some cases to be able to apply these tests legitimately.
Non-Parametric Tests
Non-parametric tests do not make assumptions about underlying data distributions. They are applicable in cases when the distribution is unknown, not normal, or sample size is small.
Some useful non-parametric hypothesis tests are:
- Chi-Square Test: Used for testing relationships between categorical variables. Can test goodness of fit or independence in contingency tables.
- Mann-Whitney U Test: Non-parametric alternative to the two-sample t-test for comparing differences between two independent groups.
- Wilcoxon Signed Rank Test: Non-parametric paired difference test alternative to the paired t-test. Used when data does not meet normality assumptions of the paired t-test.
- Kruskal Wallis Test: Non-parametric version of ANOVA used to compare means from two or more groups. Used when assumptions of ANOVA are not met.
While non-parametric tests have lower statistical power in general, they provide greater flexibility and can be used as confirmatory tests when parametric assumptions are suspect.
One-Tailed and Two-Tailed Tests
Hypothesis tests can be One-tailed or Two-tailed depending on the hypothesis and whether the direction of effect is stated.
- One-Tailed Test: Used for directional hypotheses when the researcher has clear theory or evidence to expect an effect in one direction only, such as a positive or negative effect. Uses rejection regions on only one side of the distribution.
- Two-Tailed Test: Used for non-directional hypotheses where the effect can be in either direction. Requires rejection regions on both tails of the distribution since an effect greater or less than the null value may be significant.
Choosing between one and two tailed tests is important to control type 1 error and interpret p-values correctly. A directional hypothesis predicts that an effect will only be higher/lower than some benchmark, while a non-directional hypothesis implies it can differ in any direction significantly.
Pairing the right test type with each data experiment is crucial to extracting meaningful insights. Testing normality of data, directionality of the hypotheses, required analysis etc. guide selection.
Common Errors to Avoid
While hypothesis testing is an essential statistical analysis technique, misapplying it can lead to biased results and invalid conclusions instead of sound, evidence-based decisions. Some common pitfalls to be aware of include:
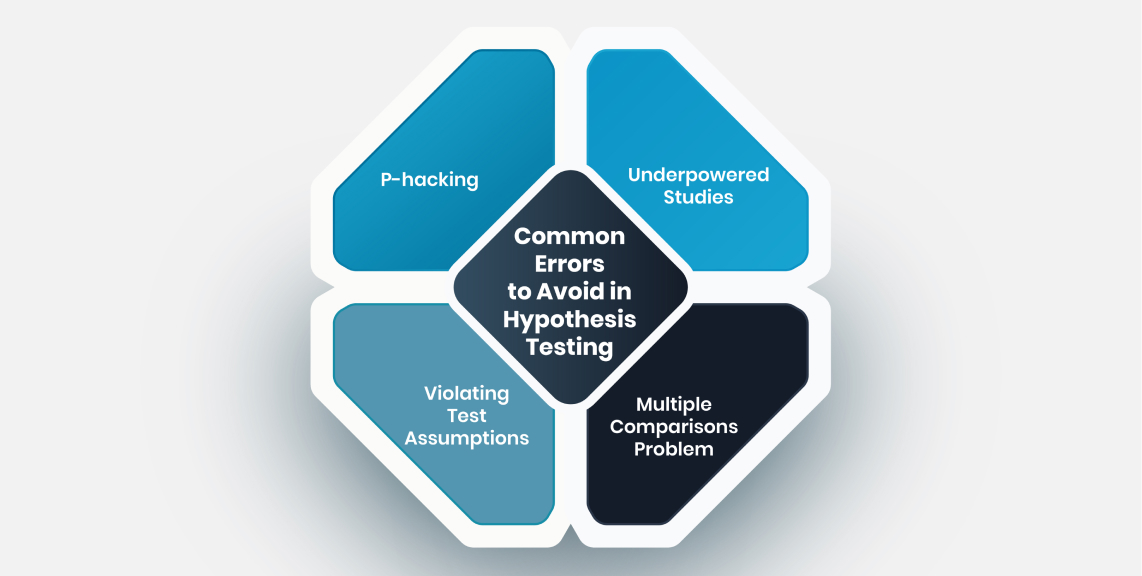
P-hacking
P-hacking refers to the problematic practice of continuously modifying data or statistical methods until the test produces a desired "significant" p-value that leads to rejecting the null hypothesis. This could involve removing outliers, trying multiple analytical approaches, excluding certain data points, etc. solely to achieve statistical significance.
Such selective reporting artificially inflates the rate of Type I errors, where the null hypothesis is incorrectly rejected even though it is actually true. Repeatedly analyzing the data in different ways until a small p-value supports the desired conclusion is an abuse of proper statistical testing protocols. It overstates the strength of evidence against the null hypothesis and leads to claims not supported by the true signal in the data.
Safeguards against p-hacking include pre-registering analysis plans before data collection, adhering to the analysis strategy, and full disclosure of all analytical approaches taken. The conclusions should depend on the data and not vice-versa.
Underpowered Studies
A study is underpowered when the sample size is too small to reliably detect true effects or relationships within the data. Standard hypothesis tests depend on having adequate statistical power based on sample size calculations and the expected effect size.
Choosing samples that are too small for the hypotheses being investigated increases the likelihood of Type II errors. That is, the test fails to identify underlying patterns that are genuine but subtle, so the null hypothesis is incorrectly retained. This could lead to assertions that an intervention had no effect when a larger trial may have revealed important benefits.
Researchers should determine the necessary number of samples, considering factors like minimum detectable effect size, before finalizing study designs to avoid this outcome. Power analysis provides a framework for these sample size calculations based on the desired statistical power.
Violating Test Assumptions
Most common statistical tests like t-tests, ANOVA, regression etc. rely on certain assumptions about the data distributions - normally distributed residuals, homoscedasticity, independent samples etc. Violating these test assumptions invalidates the accuracy of p-values and conclusions drawn from these techniques.
For instance, using a normality-based test on heavily right-skewed data could distort findings. Similarly, applying methods suited for independent samples to matched or clustered data reduces validity. Checking that the data characteristics align with test requirements before selecting approaches prevents this scenario. More flexible, assumption-free methods like permutation tests may be preferable alternatives.
Carefully examining the test assumptions and data properties protects the analysis from pitfalls due to mismatch. Graphical checks, statistical tests for normality, outliers etc. facilitate this model adequacy verification.
Multiple Comparisons Problem
When simultaneously testing a large number of hypotheses on a dataset, the probability of rare events increases compared to testing fewer questions. With every new hypothesis, there is an associated Type I error rate that compounds as more comparisons are made.
Consequently, just by random chance, some null hypotheses which are actually true would get rejected as the number of tests grows. This "multiplicity effect" means that caution is warranted in interpreting the significance of positive findings in such cases.
Using more conservative p-value thresholds, false discovery rate control procedures, and similar adjustments helps account for these multiple comparisons issue when handling many hypotheses.
By understanding the shortcomings of statistical testing procedures, configuring robust experiments, and making educated, ethical choices during analysis, data scientists can harness the power of hypothesis testing while minimizing unwanted outcomes.
Applications of Hypothesis Testing Across Industries
Hypothesis testing has become ingrained into business intelligence and data science workflows, including:
Marketing: A/B Testing Webpages to Improve Conversions
In marketing, hypothesis testing is commonly used for A/B testing of web pages and ads to improve conversions. The process involves:
- Identifying a Key Metric: The first step is determining the key metric to test, such as click-through rate, time on page, or number of purchases. This metric serves as the dependent variable.
- Formulating Hypotheses: The next step is stating the null and alternative hypotheses. For example, the null hypothesis could be that a new page layout does not affect click-through rate, while the alternative is that the new layout improves click-through.
- Implementing Variants: The webpage or ad is then changed in some way to create variant A and variant B. For example, changing button color, image placement, or copy.
- Traffic Split Testing: Incoming website traffic is randomly split between variant A and B.
- Analyzing Results: Using statistical hypothesis testing, the performance of the variants is analyzed to determine if the difference in the key metric is statistically significant.
By experimenting with multiple variants, marketers can optimize web pages and ads to maximize conversions through an evidence-based approach.
Recommendation Systems: Validating Predictive Algorithms
In recommendation systems, hypothesis testing helps assess the accuracy of predictive algorithms. Steps include:
- Selecting Evaluation Metrics: Typical metrics are precision, recall, RMSE, etc. This is the dependent variable.
- Creating a Null Hypothesis: This assumes the algorithm's performance is no better than random chance.
- Generating Recommendations: The algorithm makes product recommendations for a hold-out test set of customers.
- Comparing to Random: The evaluation metrics are compared between the algorithm's recommendations and randomly generated ones.
- Hypothesis Testing: Statistical tests like t-tests determine if the algorithm performs significantly better than random.
By empirically validating predictive accuracy, ineffective models can be improved or replaced to enhance personalization.
Finance: Backtesting Investment Strategies
In finance, hypothesis testing enables backtesting trading systems on historical data. The process works as follows:
- Selecting Metrics: Key metrics are annualized return, Sharpe ratio, max drawdown etc. This is the dependent variable.
- Null Hypothesis: Assumes mediocre performance based on benchmarks.
- Applying Strategy: The investment strategy's logic rules are coded and run on past market data.
- Generating Returns: The strategy's historical performance metrics like return and risk metrics are calculated.
- Hypothesis Testing: Statistical tests determine if returns are significantly higher than the null hypothesis after accounting for risk, fees, slippage etc.
Backtesting facilitates building robust algorithmic trading strategies that are verified to work well on real financial data.
Autonomous Vehicles: Comparing Object Detection Models
Hypothesis testing is vital when evaluating computer vision models that detect pedestrians, traffic lights and road signs in autonomous vehicles. The workflow is:
- Defining Evaluation Criteria: Key metrics are precision, recall, inference speed etc. which serve as dependent variables.
- Null Hypothesis: Assumes model is no better than a minimum performance threshold.
- Making Predictions: Both models make object detection predictions on an identical test dataset under simulated conditions.
- Comparing Performance: The models are benchmarked using evaluation metrics to quantify differences.
- Hypothesis Testing: Statistical tests determine if any performance gaps are statistically significant.
By rigorously validating performance, autonomous vehicle producers can select the best model to optimize safety.
Drug Trials: Testing Efficacy of Medicines
During clinical trials, hypothesis testing provides evidence regarding the efficacy and safety of experimental drugs by:
- Identifying Variables: Metrics include disease improvement, side effects incidence etc. These become dependent variables.
- Null Hypothesis: Assumes drug is no better than existing medications or placebos.
- Administering Treatment: The drug is administered to randomly assigned patient groups.
- Analyzing Effects: Patient outcomes are measured and compared between groups using statistical analysis.
- Hypothesis Testing: Tests like ANOVA determine if the drug performed significantly better than the null hypothesis.
By leveraging hypothesis testing, pharmaceutical companies can conclusively demonstrate clinical efficacy to regulatory bodies before drugs are approved
Public Policy: Evaluating Effects of Interventions
Governments can harness hypothesis testing to guide public policy decisions. The framework helps evaluate the impact of interventions like:
- Defining Metrics: Performance indicators related to the policy become dependent variables.
- Null Hypothesis: Assumes intervention has no effect on the population.
- Implementing Interventions: The policy is applied to specific test regions or groups.
- Measurement: Data is gathered over time regarding the defined metrics.
- Hypothesis Testing: Statistical analyses like difference-in-differences tests estimate the intervention's effect
Quantifying real-world impact instills confidence in policymakers that taxpayer money is funding programs that deliver results.
By moving from conjecture to statistically-tested evidence across domains, organizations reduce risk, target resources effectively, and accelerate growth.
Wrapping Up
As a versatile toolkit applicable across sectors and scenarios, hypothesis testing will continue empowering data scientists to move ideas from conjectures to actions. Mastering the formulation of competing hypotheses, mapping appropriate test statistics, determining significance levels, and deriving contextual inferences remains an essential capability for maximizing data’s decision-making utility.
By incorporating hypothesis testing’s core philosophies – framing assumptions, testing them objectively, and letting data guide next steps – organizations can accelerate innovation cycles while minimizing risk. With the power of statistical testing, making informed decisions becomes a repeatable competitive advantage rather than a sporadic phenomenon.