Tools for business intelligence, CRM software, and the application of artificial intelligence provide sales and marketing departments with the opportunity to choose from a variety of choices to collect and analyze data. However, the real issue is in the sheer amount of data that is available and the complexity of it: It is not enough to just generate data and numbers.
It is of little value if people are not able to comprehend the context of it. The main goal is to communicate the significance of the numbers and the data. Whereas data-driven storytelling presents the naked figures so that customers and stakeholders find them readable, fascinating, and engaging.
Let's explore the basics as well as the main reasons to employ data-driven storytelling.
What is Data-Driven Storytelling?
The capability to convert raw data into simple-to-read and simple-to-understand stories that assist in turning insights into actions is referred to as Data-Driven Storytelling.
It's a systematic approach to convey data-driven information through visualizations of data, infographics, dashboards, and other graphic elements.
We're wired to think in a visual way, which is why turning data into an image is crucial for everyone looking to make the most of the value data offers in their businesses.
Research survey has revealed that at the very least, 65% of all people are visual learners. We can recall just 10% of what we read, 15% of what we listen to, and 75% of what we look at. Also, we process visuals 60 times faster than text and tend to pay attention to images. We also can retain pictures with a minimum of 90 percent accuracy.
Data-driven storytelling can influence actions both within and outside the organization. Within the organization, it may assist your team in discerning what is most essential and then acting upon it. Outside of the organization, Data-driven storytelling is used to inspire the desired action. Examples of such activities include joining a newsletter, adding an item to your shopping cart, shopping online, or publishing content via social media.
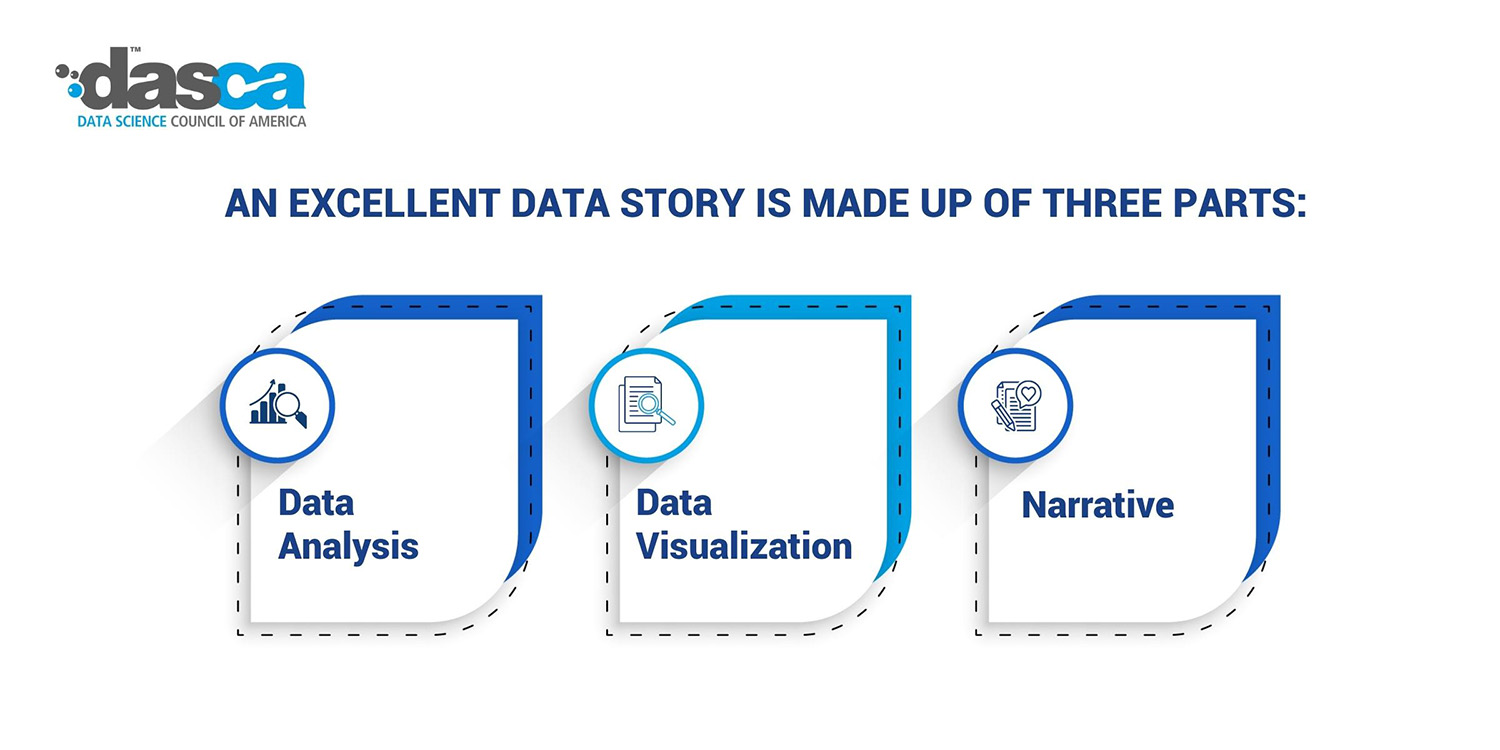
An excellent data story is made up of three parts:
-
Data Analysis
-
Data visualization
-
Narrative
Data analysis
The data analysis aspect is the foundation of every great story, so mastering your data is crucial in the entire process. To gain actionable insights, data storytelling requires current and precise data. It is the very first stage of the process, and if it is not done correctly, it won't yield the expected results.
Data visualization
Visualizations are a highly effective method to tell a data-driven story. They draw the audience's attention, trigger emotions, and aid in data-based decision-making.
Data visualization allows us to see patterns and trends that may be missed otherwise. It additionally helps us communicate the significance of the data in a manner that is easy to comprehend, appealing and memorable.
The insights gleaned from the data are displayed in infographics, charts, tables, and other visual elements such as tree map charts & even videos.
Narrative
What is a story without narration? The narrative part of data-driven storytelling describes the data. It highlights important KPIs, metrics, trends, and speeds up the decision-making process. Narratives help visualize the data most straightforwardly, something which is feasible.
Data-driven storytelling is essential in today's world, and Here’s why companies should adopt it?
A study by Standford's professor Chip Heath (Made to Stick author) discovered that 60% of the participants could recall stories, whereas only 5% could remember statistics. Even though 2.5 statistics were used on average for the exercise, only 10% of participants used a story, and the stories were what captivated people's attention.
This just shows the importance of data storytelling to create a data-driven culture. In business, the ability to see patterns and identify the causes of problems or even understand the way your marketing campaigns are doing is invaluable. Data alone cannot give this meaning since it must be seen with the context of the situation. Utilizing the elements of storytelling can help us comprehend the context.
If you're still unconvinced, here are a few additional reasons to use data-driven storytelling as a communication tool:
-
Credibility - Using numbers and data can help you prove your claims and validate your content. It is essential to establish trust while building relationships with your readers.
-
Value - Data-driven stories add significant meaning and context to allow the reader to discover the connections between different aspects and put the insights into action accordingly.
-
Adaptability - Data-driven stories can be integrated into various internal & external communication channels such as videos, case studies, presentations, website content, white papers, and more. Data can be visualized to fit into any format as per requirement.
-
Attention - A great piece of content based on data is distinctive and elevates your brand's visibility by introducing it to newer audiences.
In general, businesses can accomplish more and get better results from the data they collect if they understand it fully. People who are fluent in data will increase the overall data literacy levels of your organization. It is imperative that your company starts developing a cadre of data storytellers who can find insights and share them in clear meaningful ways.
How Does Storyboarding Help in Data Storytelling?
Creating storyboards is an excellent method to extract the key messages and data elements out of lengthy and complex reports and organize them. This process can help transform abstract concepts into concrete plans for your data story.
Here is the process of storyboarding in four simple steps:
-
Outline - the first stage of the process, you must identify the most critical details that you would like to communicate to your target audience.
-
Draw it out - Use this method to write down all the items you're planning to use as raw material. Sketch them out on your storyboard. You must ensure that you've collected all the details and essential elements required to tell your story.
-
Layout the storyboard. Think about how this story will take place and are there any gaps or anything you won't need.
-
Brainstorm visualizations - the final step is to imagine how you'll display your data and then test different concepts.
The most crucial aspect of storyboarding is identifying the critical data points and the takeaway messages you would like to include in your story. After that, and with the help of a visualization editor, your story will surely be on point.
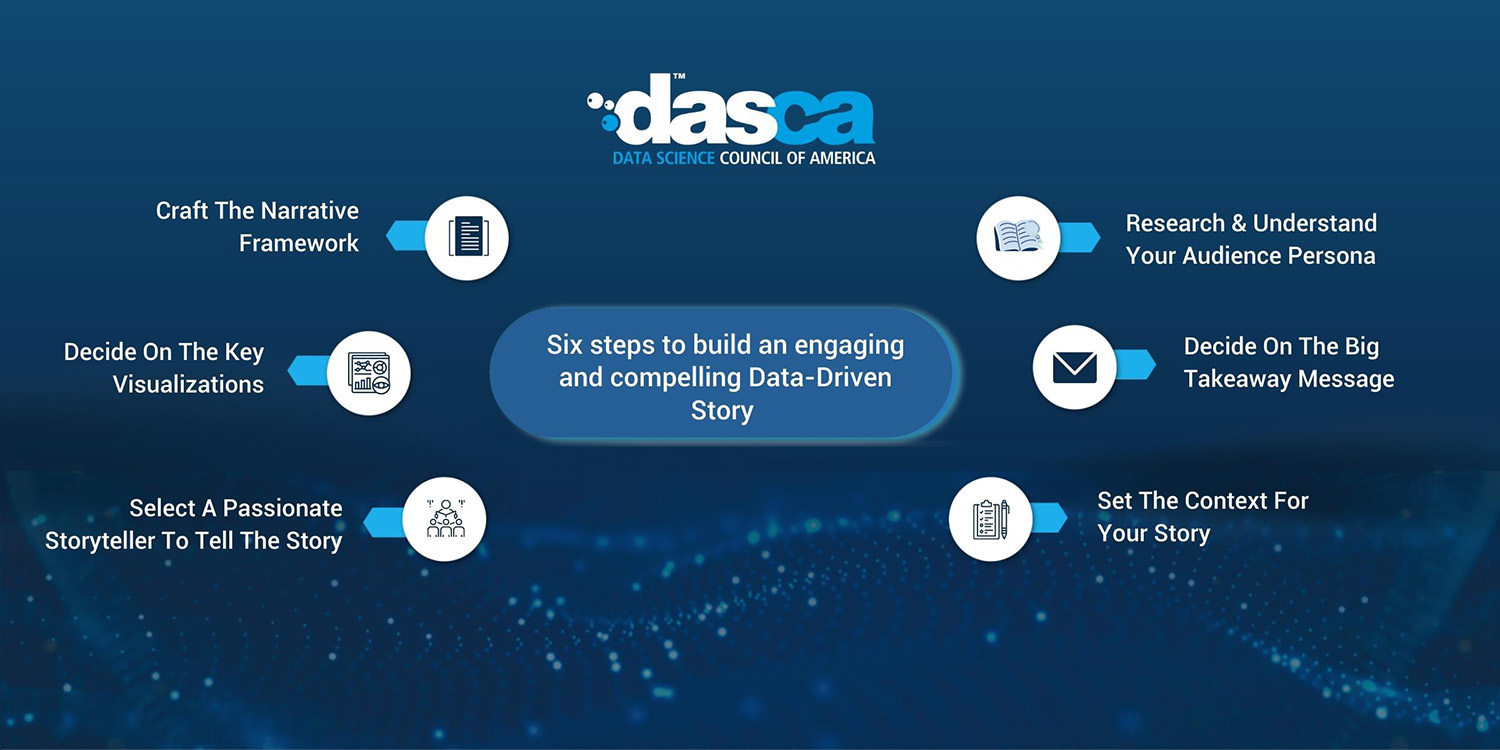
Six steps to build an engaging and compelling Data-Driven Story
How to Tell an Effective Data Story Using Data Visualization Best Practices?
A powerful data-driven narrative opens up new perspectives and concepts within the minds of those who read it by strategically utilizing narrative, visualizations, and storytelling techniques.
1. Research & Understand Your Audience Persona
The first step to writing a successful story is knowing your target audience's persona.
One of the most common errors made in data-driven storytelling is the notion that the data will be the primary protagonist of your story. Although the insights you gained could be revolutionary, most stories are about people. They are usually focused on your target audience or closely related to them.
Consider these six key questions to help you in defining your target audience for the story you're creating:
-
What are the demographics of your customers?
-
Who are the stakeholders involved?
-
What are the issues or challenges they face in their professional and daily life?
-
What KPIs or metrics are they tracking?
-
What are their skills levels?
-
What do they get influenced by?
The more you can explore the personality of your target audience, the more your story will resonate with them.
2. Decide On The Big Takeaway Message
Every great story is based on a fundamental idea, and viewers can take a significant takeaway even if they don't remember anything else.
Understanding the critical takeaway is important in creating your ideas to support them effectively. If the focus is on climate change, then the primary message could be the need to cut down on plastic in our everyday lives.
In this way, the best questions can be posted to your analytics tool, mainly if it's driven by conversational analytics to uncover the most relevant information to increase credibility and strengthen the public's understanding of the takeaway message.
3. Set The Context For Your Story
Context is the king of storytelling. It is crucial to describe the background and the setting of the events in your story.
It has to go beyond words.
In the case of your data-driven narrative, you should quickly communicate to your readers why the information you provide is vital to them and the reason they should be paying attention to it.
For instance, a story about a startup that grew exponentially before being purchased for a million dollars could be bought for a billion dollars can be fascinating, but it lacks context.
Adding that the company's growth occurred during the financial crisis when investments were scarce and customers were challenging to find instantly adds a sense of "heroic struggle" to the story.
And if your target audience is entrepreneurs in this context, it is one which they could directly identify with or would have already given it some serious thought.
4. Craft The Narrative Framework
Also called the story arc, it is the basic timeline of your story.
While there are numerous narrative and dramatic frameworks that you can use, There is one that can be used as the skeletal framework to build your story.
That is Freytag's pyramid, which comprises five main phases:
Exposition:
Here, the background and the context are presented, and the main characters (or players) are introduced to the audience.
Rising Action:
In this section, supporting facts such as visuals can strengthen the narrative to deliver the critical message for the audience's takeaway.
Climax:
It is the high-value point where the key message for the audience's takeaway will be highlighted. It's the point when decisions must be made to address the issue, or dangerous consequences have to be faced.
Falling Action:
This is the stage where the dire consequences are explained, along with the slight possibility of a reversal (backed by facts and data, of course).
Resolution:
The story concludes with a ray of hope and concrete steps that readers can immediately take to get to the "promised land."
If your story centers around one person or a protagonist, make sure you look at Joseph Campbell's Hero's Journey - it is an excellent narrative template you can utilize.
5. Decide On The Key Visualizations
After the story is in place, the next logical step is to combine the relevant data and insights through visualizations.
An excellent way to pick the most appropriate visualization is to formulate the right questions and choose the best visualization that addresses the question in the most direct way possible.
Here are four of the most commonly utilized data visualizations:
Trends:
They're amongst the most commonly used visualizations in data-driven storytelling. It can be used for many different topics, from population to business.
Comparison Charts:
If your story is populated by many participants and a comparison is inevitable, it is one visualization you can try out.
Ranking Tables:
In the case of comparing countries, businesses, and even individuals, ranking tables are an excellent method to show quick insights in a way that can be reached.
Heat Maps:
Particularly effective in the case of stories focused on the volume of people and population concentrations.
6. Select A Passionate Storyteller To Tell The Story
Once your story has been completed with the critical insights that are presented in stunning visualizations that flow seamlessly - you're getting close to the end of the road!
The last step is to designate the company's storyteller to share these insights in a manner that goes beyond a corporate presentation.
You'll need to choose an actor who does not just know what the narrative and its implications mean but can effectively control and direct the narrative's focus and even make the audience feel uncomfortable and tense at moments that require them to feel so.
CONCLUSION
Data-driven storytelling is capable of more than what it has been used for. It has the ability to uncover insights from your data that you might have missed before. Relations between peculiarities and data that numbers can never clearly depict can be shown using stories and charts.


